How Retailers Can Use ObservePoint for an Ultra Successful Q4

Are you a retailer gearing up for the busy holiday season in Q4? Then this article is for you! See how ObservePoint can help you make sure your websites are ready to track the increased ad spend and handle the uptick in traffic and conversions. You will also find some new charts from the data we used to write our annual report, where we drilled into retail sub-industries, so you can compare how your site performs against others in your category.
Landing Page Performance
With all the ads you might be running for Q4, you need to make sure that your campaign landing pages are providing smooth user experiences and tracking correctly. You know why this is important. Landing pages are a central point of customer engagement, sometimes even the first experience with your brand, and the data you collect from those pages inform the rest of your demand strategies.
So what does the ObservePoint platform do for your landing pages? Here’s just a summary:
- Check if any landing pages are broken: 5-10% of paid media landing pages are going to broken experiences. With ObservePoint, you can paste all your landing page links into a single Audit and get a Page Summary report that includes broken pages.
- See page load times: Slow-loading pages are an invitation to bounce. Google and Bing will also ding your quality score if your page takes more than 3 to 4 seconds to load, which drives up your cost per click.
- Make sure redirects don’t strip important campaign IDs or other variables: You can see every URL in your redirect chain.
- Confirm analytics tags are present on your landing pages.
- Verify the values of each campaign variable.
In our annual Web Governance Report, we found that the average page load time of the 11,000 homepages we scanned was 4.23 seconds. If we look at only Retail websites, that number was 4.16 seconds, so kudos for doing better than the average, retailers!
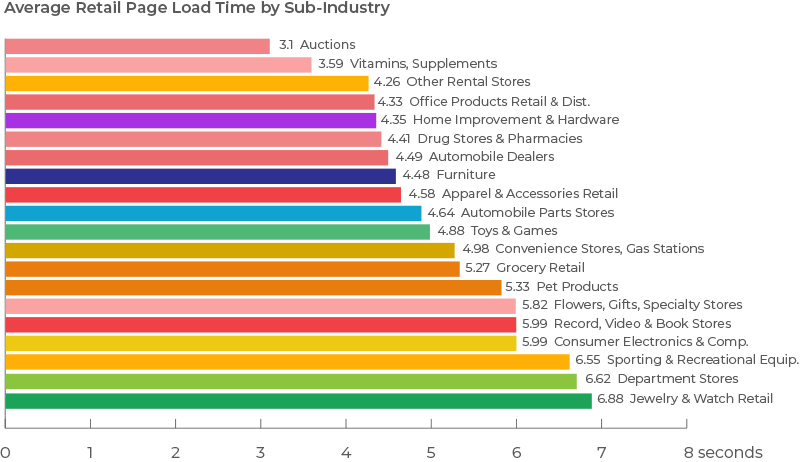
However, let's look at Average Page Load Time of all Retail accounts in our data set (there were 997) and break out the sub-industries. You can see in the chart above that Auction sites are at a speedy 3.1 seconds and Vitamins, Supplements, & Health Stores came in second with 3.59 seconds. Auction companies might need speedy sites for bidding activities, but we're super impressed that vitamin and supplement sellers are also so conscientious about page load time.
It looks like Jewelry & Watch sellers are luxuriously lazy about conversions, probably because no one is super in a hurry to buy engagement rings or Rolexes. But those big stores right above last place in Sporting & Recreational Equipment and Department Stores, Shopping Centers & Superstores need to step it up a bit. Especially since we were only measuring homepages and not even trying to find SKUs. If you’re one of these types of retailers, imagine how much better your experience could be compared to your competitors if you made adjustments to speed up your site?
Analytics Validation
How many times has a tag fallen off, leading you to guesstimate how your campaign performed or fly blind for days or weeks without realizing your data was kaput? Governing analytics implementations was how ObservePoint started out, so this is second nature to us. We can help you:
- Verify your analytics tags are present and firing properly on every page.
- Make sure data is being passed to the appropriate destinations, such as report suites, properties, etc.
- Confirm what variables are being populated by your analytics platform.
- Check if your data layer is mapping correctly to your analytics.
- Validate that event tracking is occurring when and where it should be.
- Illustrate if specific values remain consistent throughout a user’s journey through your site.
Retail companies just have more tags than other industries.
- Average # of Tags: 25.62
- Average # of Tags Retail: 33.65
However, retailers are better at getting their tags to load faster than average.
- Average Tag Load Time: 415.03 ms
- Average Tag Load Time Retail: 388.12 ms
This seems pretty logical for a vertical that has a lot of marketing campaigns that need to be tracked and a lot of cool functionality on their sites but understands that slow pages chip away at conversions.
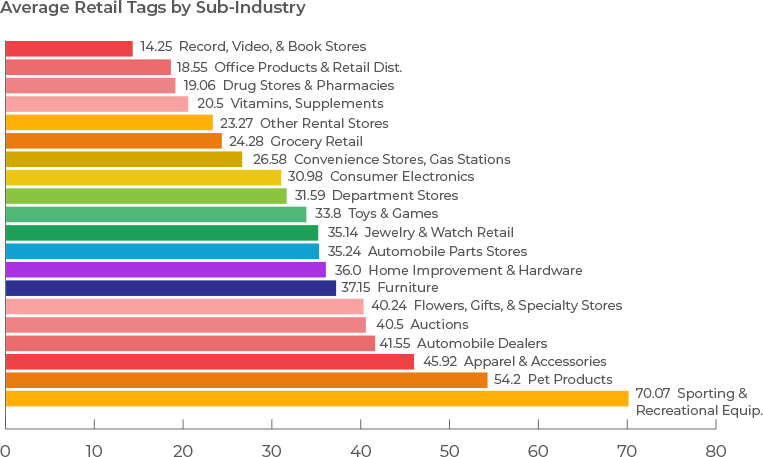
Look at the chart above to see average tags broken up by Retail’s sub-industries. Record, Video, & Book Stores have the least number of tags at 14.25, while Sporting & Recreational Equipment (again, guys?) are coming in last with a whopping 70.07 tags! Maybe that’s what’s slowing your pages down?
Privacy Compliance
This is the part that marketing people wish they didn’t have to worry about. Are you abiding by website privacy regulations? Are you double-checking? Probably not, right? Get this all automated, so you don’t have to keep procrastinating about it:
- Verify that your privacy policies and “do not sell/share” links are on every page.
- Make sure your cookie consent banner is on every page.
- Test that your Consent Management Platform is effectively blocking or allowing user-specified cookies and tags. You can quickly test Accept All or Reject All with ObservePoint’s platform.
- Know the complete origin story of every cookie on your site, so you can manage, modify, or remove them.
- Find out where and when new or unapproved technologies are appearing on your site.
- Check if there are network requests coming from unauthorized regions or domains.
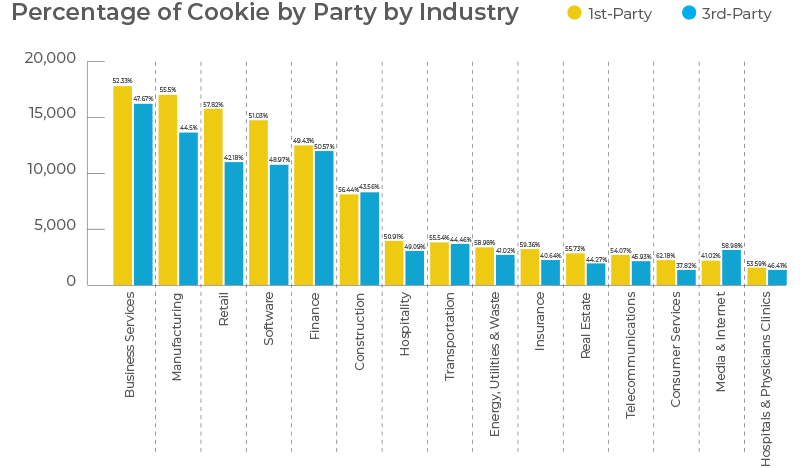
Retail companies had the third most cookies compared to other industries. The average number of cookies overall was 17.75, and retailers had 26.92. We didn’t include a chart here on cookies because it pretty much mirrors the tags chart above. But look a the distribution of first- and third-party cookies. Retailers are actually doing a little better than many of the other industries in terms of relying less on third-party cookies.
If you’d like to see what’s really going on with your website’s landing pages, analytics, and privacy, then sign up for a Free Trial. You’ll get summarized reports about the health and performance of your site that you can share with your colleagues. Then you can get to work optimizing your website for Q4 or any other quarter’s mayhem.
Related Posts

ObservePoint and AI: Using AI to help you innovate with ObservePoint

Top News from IAPP Global Privacy Summit 2024

How to Interpret an Audit Report
Getting to Know the ObservePoint Audit Report

ObservePoint + NP Digital: How Digital Marketers Should Prepare for 3rd-Party Cookie Deprecation

Does Your Site Work Without 3rd-Party Cookies?
ObservePoint and AI: Using AI to help you innovate with ObservePoint
Top News from IAPP Global Privacy Summit 2024
How to Interpret an Audit Report
Getting to Know the ObservePoint Audit Report
ObservePoint + NP Digital: How Digital Marketers Should Prepare for 3rd-Party Cookie Deprecation